Visualization Tools Overview

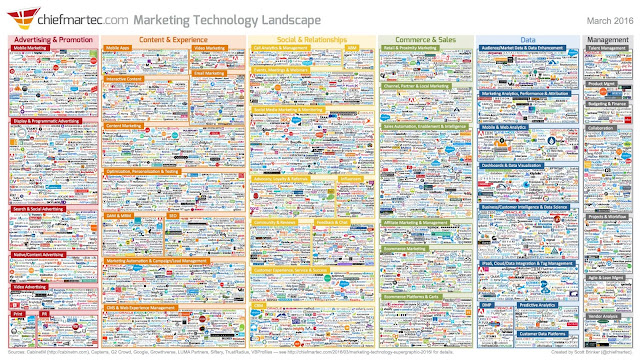
The above image is a list of 'a handful' of companies working in the Marketing Technology space. Only about 8% of them are very large, but as you will notice, a slew of them are in Data. Within Data, there are always new niche players coming up with neat visualizations tools. However, I will address just a few of the large players today. TABLEAU Much has been said about the benefits of Tableau as a data visualization tool, particularly for large datasets. It is certainly a wonderful software once you learn to use it, the drag and drop interface makes it super easy to handle. Unlike basic Excel, Tableau can work with extremely large amounts of data, and can analyze that data very quickly into highly interactive graphs, charts, and geographic visualizations. The availability of heat mapping and color coding to illustrate vast amounts of data across a geography is perhaps one of my favorite features. Notably, Tableau doesn't work with unstructured data well,...