Posts

Data Visualizaton Tool of the Day-Raw

Today's data visualization tool is Raw.  An interesting choice of names for a not so raw experience designing easy to make, sophisticated-looking graphs. 4.   Raw Pitch:   Raw is an open-source visualization 'framework' designed to make visualizing complex data easy and accessible for all. Review:   Useful for smaller, complex, but definitely not big data sets as the content must all be  copied and pasted into the platform's excel-style interface.  That said, it caters to the less tech-savvy visualization geeks offering an easy drag and drop interface to produce beautiful 3D.js-based graphics.  
Data Visualization Tool of the Day - Charts.js

Charts.js is today's featured data visualization tool.  I won't lie, I am not sure how much coding is involved so I may not be to produce graphs with Charts.js, but we shall see!!  To be continued... 3.   Charts.js   Pitch :  Javascript charting for designers and developers. Review :  Charts.js is open-source charting code that provides 8 categories of charts.  While visually simply, Charts.js allows interactivity for the user to mouse over and identify and understand data points and events.   This functionality is great for in-depth exploration by the user, like you would expect in an in-depth digital magazine case study or as part of a museum kiosk feature.

Data Visualization Tool of the Day- Data Hero

Today's data visualization tool  is Data Hero. 2.   Data Hero . Pitch : The fastest, easiest way to understand your data. Review :  Data Hero is a cloud app which can connect with a variety of tools, such as Hubspot, Stripe, and Salesforce, to access and consolidate important data, providing recommended charts appropriate for each data type, and automatic updating or each report. It features a drag and drop interface to simplify user experience.  Given their ad video's techno music soundtrack I'm going to go out on a limb and say its geared towards the less tech savvy digital marketer.   Several of the features appear to overlap with Google Analytics tools including e-commerce tracking, customer engagement, and sight performance monitoring.   Data Hero is designed to support marketers, agencies, sales, but is not also being marketed t to financial services and education as well.

Data Visualization Tool of the Day-Plotly

Tableau may be the hottest trending data visualization tool, but its certainly not the only game in town.  Over the next few days I'm going to highlight different visualizations tools on the market and will circle back in the coming day with samples produced using each tool. Today's feature is Plotly. 1. Plotly . Pitch : Plotly pitches itself as open source visualization libraries for Python, R, Javascript, Shiny, and Dash, allowing users to create stunning and informative graphics and easily sharable dashboards. Review :  They claim to be geared for data scientist primarily, although accessible for non-coders as well.  As a key point of differentiation, the tool is collaboration-focused so that disparate teams can all access the tool and data through their 100% online platform.  Plotly also uses web-native graphics, which they point out are also employed by The New York Times. The graphs are beautiful and dynamic in 3D and colorfully nuanced using D3.js (javascript) charts

The Future of Digital Analytics in Healthcare

I recently read The Economists's March 2017 article, " A Digital Revolution in Health Care is Speeding Up. "   Several of the developments they address have me excited about this field for the first time.   We are approaching a new frontier of better outcomes, healthier lives, and I would anticipate, greater personal responsibility.  Coincidentally, the government's actions to reduce our mandated healthcare benefits are likely to accelerate consumer use of preventative care resources in this category, simply out of necessity.  This will be a boon for the makers of Fitbit and other wearable health technology providers as well as those big data gatherers who leverage the feedback from these systems and related data sources.  Overall, the new digital tools and firms outlined in the article are intended to empower patients and payers alike, above traditional service providers, thereby giving customers a substantive, information-driven approach to supporting their individu

Visualization Tools Overview

Image
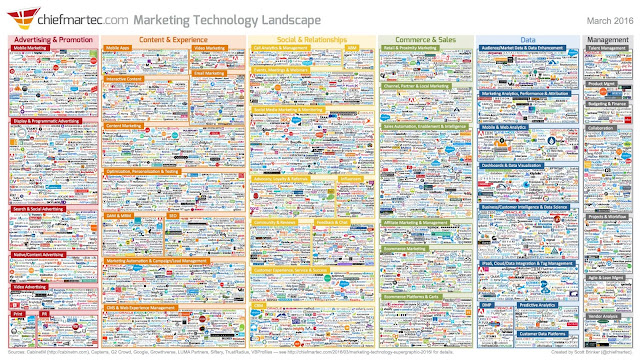
The above image is a list of 'a handful' of companies working in the Marketing Technology space. Only about 8% of them are very large, but as you will notice, a slew of them are in Data.  Within Data, there are always new niche players coming up with neat visualizations tools. However, I will address just a few of the large players today. TABLEAU Much has been said about the benefits of Tableau as a data visualization tool, particularly for large datasets.  It is certainly a wonderful software once you learn to use it, the drag and drop interface makes it super easy to handle.  Unlike basic Excel, Tableau can work with extremely large amounts of data, and can analyze that data very quickly into highly interactive graphs, charts, and geographic visualizations.  The availability of heat mapping and color coding to illustrate vast amounts of data across a geography is perhaps one of my favorite features. Notably, Tableau doesn't work with unstructured data well, as oth

Way to Monetize Data

Ultimately the end game of a marketer using data is to monetize that data.  Of course there are more or less direct methods to make a case using data; they vary in degree of complexity and investment to acquire.  They might also require teaming up with a data analyst or data scientist.  The most important point to remember is that you have to know what question you're trying to answer, you can just browse and expect to get a simple solution.  There are almost always a confluence of factors either determining or related to the problem at hand and determining causation vs. relation is an important human-level of the analysis the requires logic and experience with the subject matter. Here is a list of common ways to monetize data. 1.  Data can be used for predictive analysis to determine when customers are most likely to be shopping and on which of their devices. 2. Data can be used to segment customers by what types of products they are most likely to purchase.  Companies can d